
Research & publications Web edition
Trends and Patterns
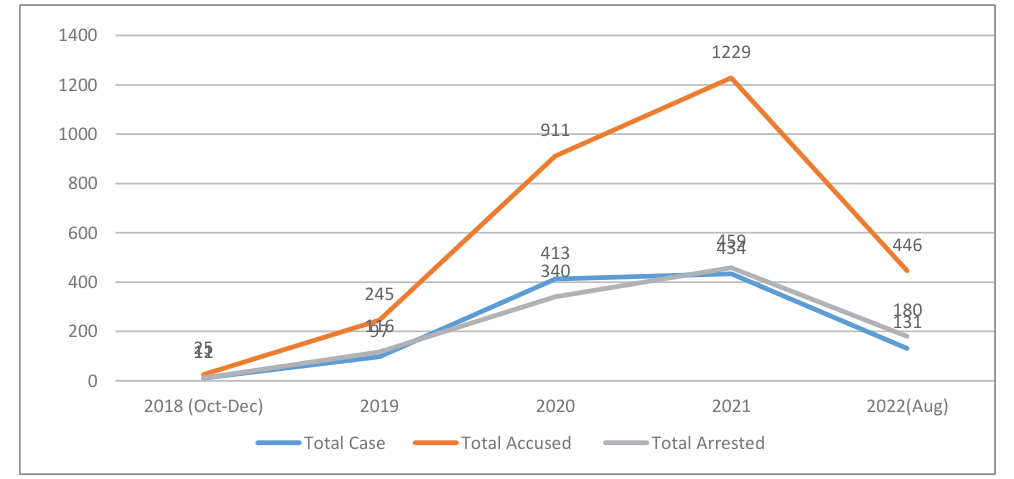
In the data gathered over the past 47 months, a few trends and patterns have emerged.
During this period, on an average per month, 23.59 cases have been filed, 61.46 persons have been accused, and 23.80 persons were arrested. Within this period, the largest number of cases were filed in 2021- per month average was 36.16 cases; 102.41 persons accused, and 38.25 persons arrested. The number of cases has declined in 2022 (until August). Per month the average cases were 16.37, average accused were 55.75 and arrests were 22.50. A press report has drawn attention to the timing of this decline and noted that the declines coincide with the imposition of US sanctions on the Rapid Action Battalion (RAB) and seven of its officials on December 10, 2021 (Chowdhury and Lion 2022).
Table 1: Number of cases, accused, and arrests, Oct 2018 – Aug 2022
| Total Case | Monthly Average | Total Accused | Monthly Average | Total Arrested | ||
|---|---|---|---|---|---|---|
| 2018 | 12 | 4.0 | 25 | 8.33 | 11 | 3.66 |
| 2019 | 97 | 8.08 | 245 | 20.41 | 116 | 9.66 |
| 2020 | 413 | 34.41 | 911 | 75.91 | 340 | 28.33 |
| 2021 | 434 | 36.16 | 1229 | 102.41 | 459 | 38.25 |
| 2022 | 131 | 16.37 | 446 | 55.75 | 180 | 22.50 |
| Year Not Specified | 22 | 33 | 13 | |||
| Total | 1109 | 23.59 | 2889 | 61.46 | 1119 | 23.80 |
As mentioned previously, politicians and journalists have been professionals who have faced a significant number of cases in the past 47 months (Table 2 and Table 3).
Table 2: Cases, accusations, and arrests of politicians, Oct 2018 – Aug 2022
| Year | Total cases | Total Accused | Total Arrested |
|---|---|---|---|
| 2018 | 3 | 6 | 0 |
| 2019 | 7 | 9 | 6 |
| 2020 | 50 | 102 | 32 |
| 2021 | 84 | 141 | 43 |
| 2022 | 15 | 40 | 9 |
| Not Found/Specified | 2 | 3 | 2 |
| Total | 161 | 301 | 92 |
Table 3: Cases, accusations, and arrests against journalists, Jan 2019 – Aug 2022
| Year | Total cases | Total Accused | Total Arrested |
|---|---|---|---|
| 2019 | 26 | 45 | 21 |
| 2020 | 50 | 100 | 34 |
| 2021 | 40 | 88 | 20 |
| 2022 | 12 | 32 | 3 |
| Not Found/Specified | 10 | 15 | 6 |
| Total | 138 | 280 | 84 |
Journalists were accused of various violations. We attempted to find out how many of these instances were related to their professional duties (Table 4).
Table 4: Reasons for accusation against journalists, Oct 2018 – Aug 2022
| For reporting | Reasons not found | ||
|---|---|---|---|
| 280 | 159 | 12 | 109 |
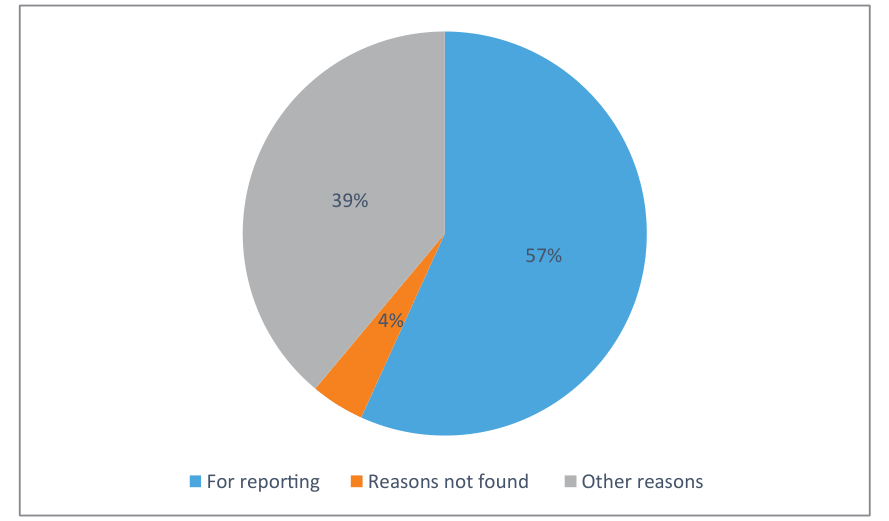
Year-wise disaggregation shows that 2020 was the worst year for journalists as they were accused in significantly high numbers. However, it is also worth noting that in 2022 (until August), 33 journalists have been accused under the DSA for reports, the second highest number. While the overall number of cases is declining, journalists are finding it difficult to report (Table 5).
Table 5: Year-wise number of journalists accused for reporting, Jan 2019 – Aug 2022
| Year | Number |
|---|---|
| 2019 | 27 |
| 2020 | 70 |
| 2021 | 24 |
| 2022 | 33 |
| Not Found/Specified | 5 |
| Total | 159 |
Note: Data shows that there were no cases filed against journalists in 2018.
Students are the third highest number of accused persons according to our data. The year-wise breakdown shows that both 2020 and 2021 were years when students faced a large number of cases (Figure 3).
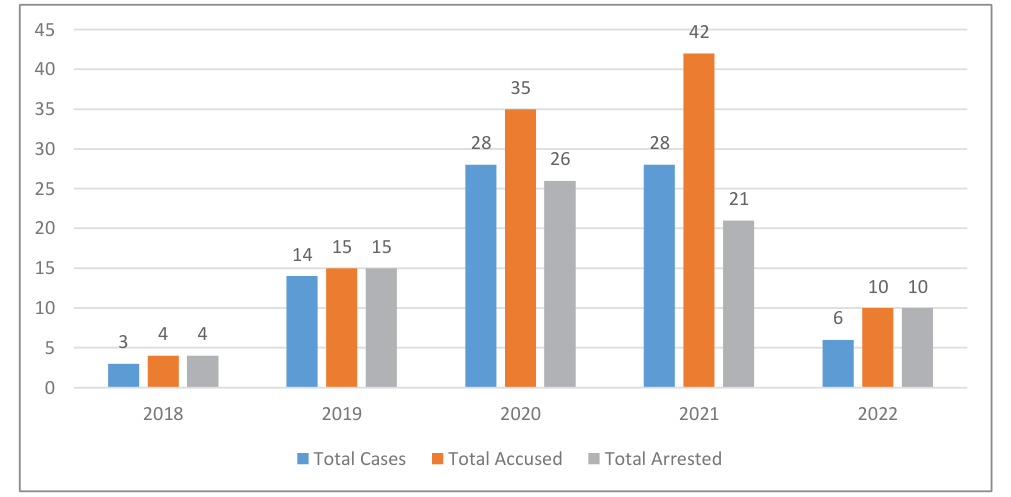
As for the teachers, 41 cases were filed over the period, 34 cases were filed in 2020 and 2021– the number of accused was 42, of which 34 were arrested (Figure 4).
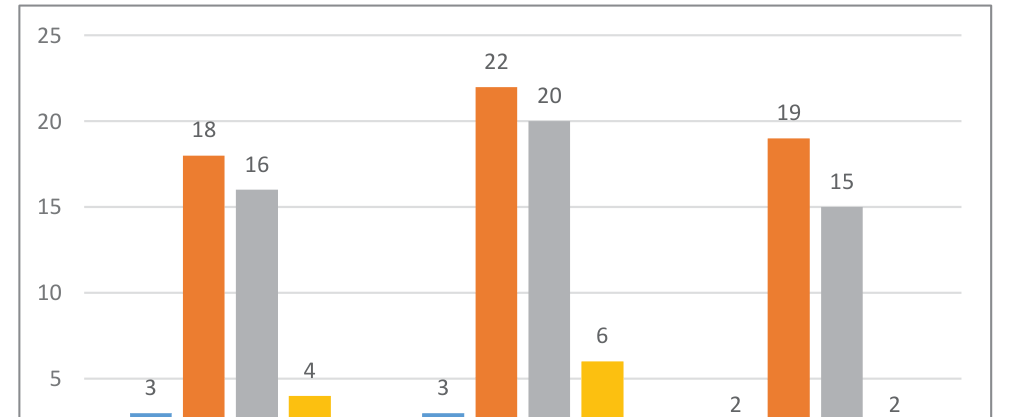
Table 6: Cases filed by ruling party activists and the number of accused, Oct 2018 – Aug 2022

Of these teachers, a total of 19 madrassah teachers were accused; 18 of them were accused in 2020 and 2021, 15 of them were arrested.
One of the key highlights of the use of the DSA is by ruling party activists against private citizens and opposition political leaders and activists. As mentioned previously, during this period, among the cases filed, we could identify 198 cases filed by ruling party activists/leaders accusing 490 people (Table 6).
Table 6: Cases filed by ruling party activists and the number of accused, Oct 2018 – Aug 2022
| Year | Total cases | Total Accused |
|---|---|---|
| 2018 | 6 | 12 |
| 2019 | 16 | 40 |
| 2020 | 75 | 215 |
| 2021 | 82 | 163 |
| 2022 | 19 | 60 |
| Total | 198 | 490 |
These data show that in the past 47 months, ruling party activists have filed 4.21 cases every month, and each case had an average of 2.4 persons accused; or in simple words, every week a case has been filed by a BAL activist against more than two persons for almost four years under one law. These cases were in addition to the cases filed by law enforcement agencies and government officials. Of the 636 cases where we identified the accusers, 192 were filed by agencies and officials; that is, on average 4.08 cases per month. This shows how pervasive the use of the law has become since it was introduced and how government agencies and party activists have used the law against people they dislike.
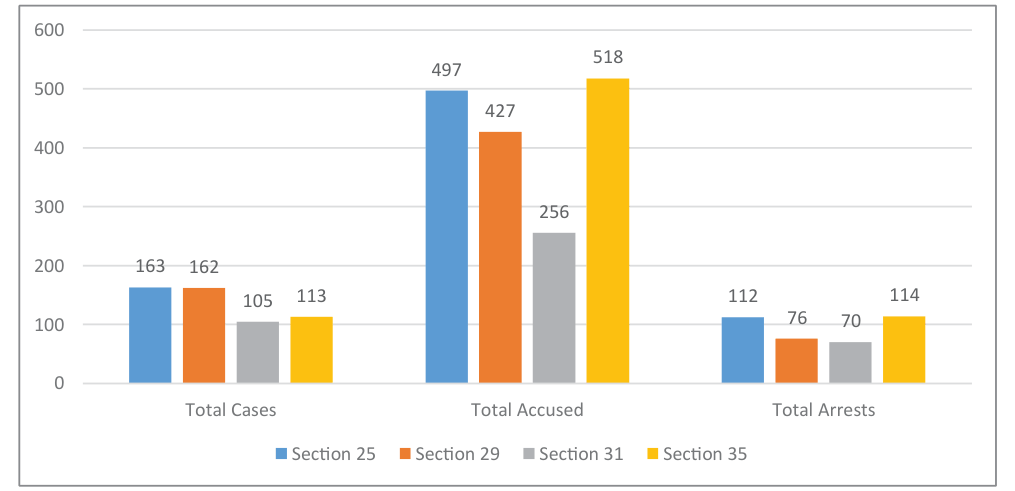
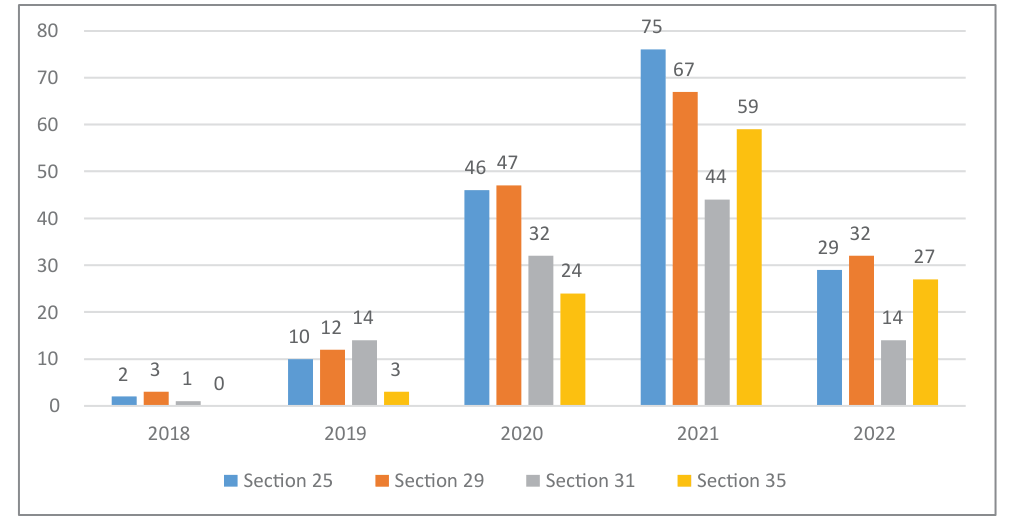
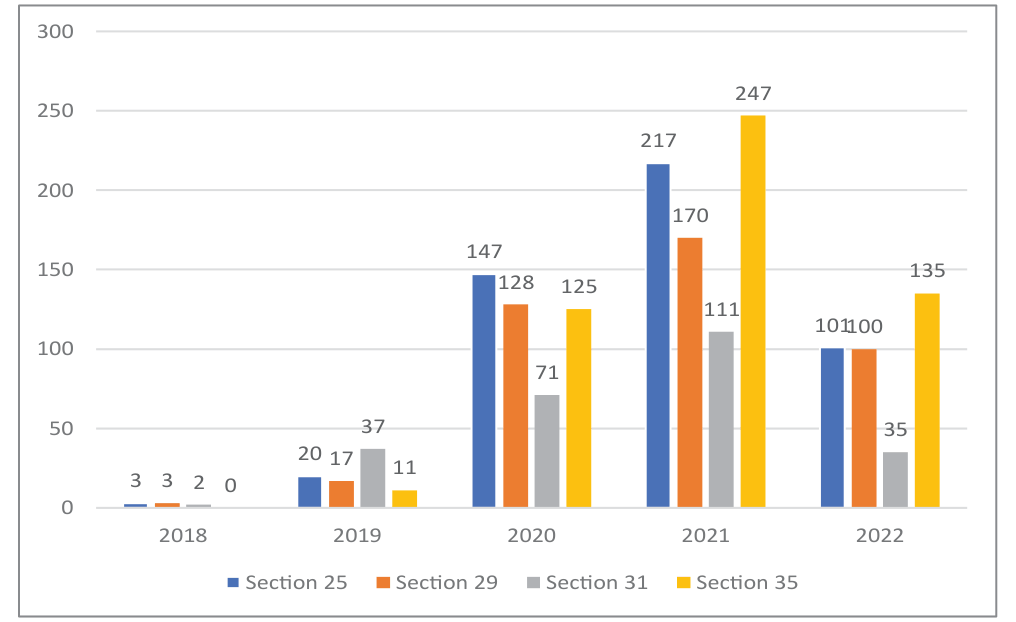
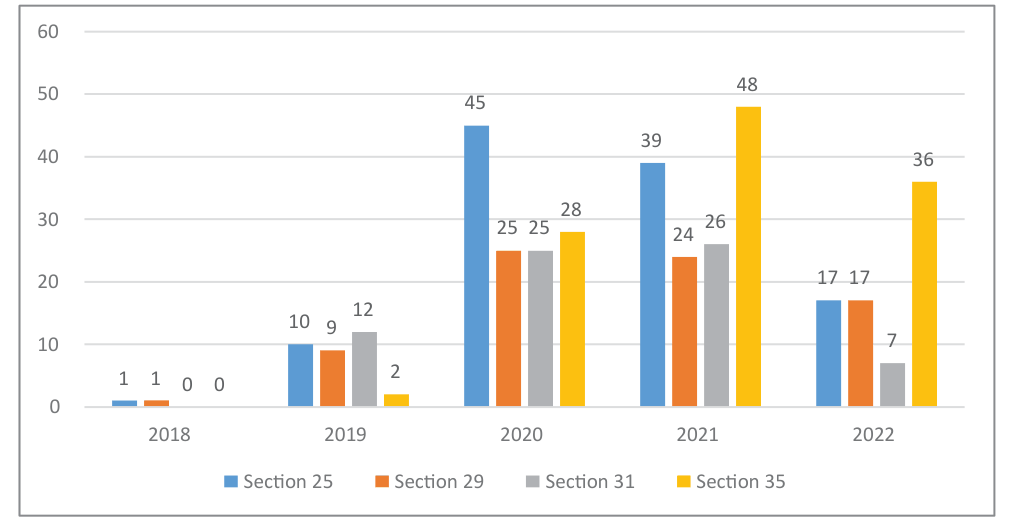
Of the four sections widely used – 25, 29, 31, and 35 – three were objected to by the journalists even before the law was passed by the parliament. On 22 May 2018, owners of private television channels, the Editors’ Council and leaders of the Bangladesh Federal Union of Journalists met the parliamentary committee and expressed concerns about eight sections – 8, 21, 25, 28, 29, 31, 32 and 43. Section 25 deals with transmission, publication, etc. of offensive, false or threatening data information; Section 29 deals with publication, transmission, etc. of defamatory information; Section 31 deals with offence and punishment for deteriorating law and order, etc. and Section 35 deals with punishment for aiding and abetting any offence under the DSA. The following three charts (Figure 6, 7 and 8) show the annual trends on the use of these four sections.
Although the DSA came into effect in October 2018, no cases alleging defamation of the PM were filed until January 2019. By then, the controversial 2018 election was held. The year-wise disaggregated numbers of the 140 cases filed for allegedly defaming the Prime Minister are the following (Table 7).
Table 7: Year-wise cases for defaming Prime Minister, Jan 2019 – Aug 2022
| Year | Number of Cases |
|---|---|
| 2019 | 12 |
| 2020 | 57 |
| 2021 | 59 |
| 2022 | 12 |
| Total | 140 |
In 2018, in three months, only one case was filed alleging defamation of a minister (Table 8).
Table 8: Year-wise cases for defaming ministers, Oct 2018 – Aug 2022
| Year | Number of Cases |
|---|---|
| 2018 | 1 |
| 2019 | 5 |
| 2020 | 34 |
| 2021 | 16 |
| 2022 | 8 |
| Total | 64 |
As for politicians, like others, the year 2020, was the worst since the DSA came into effect in October 2018 (Table 9).
Table 9: Year-wise cases for defaming politicians, Oct 2018 – Aug 2022
| Year | Number of Cases |
|---|---|
| 2018 | 2 |
| 2019 | 19 |
| 2020 | 63 |
| 2021 | 61 |
| 2022 | 22 |
| Not Specified | 1 |
| Total | 168 |